class: center, middle, inverse, title-slide .title[ # 为你的团伙写一个 R 包 ] .author[ ### 高春辉 @ 资环 × 微重 × 作重 ] .date[ ### 2023-10-20 ] --- ## 关于自己 ### Data Scientist  参见:[我的简历](https://bio-spring.top/cv/) --- ### GitHub A- 级开发者  去年是 A+ 级。 --- ### GitHub 记录 - 一言不合,反手 PR  --- - 我为大佬补漏洞:<https://github.com/rstudio/gt/pull/137> 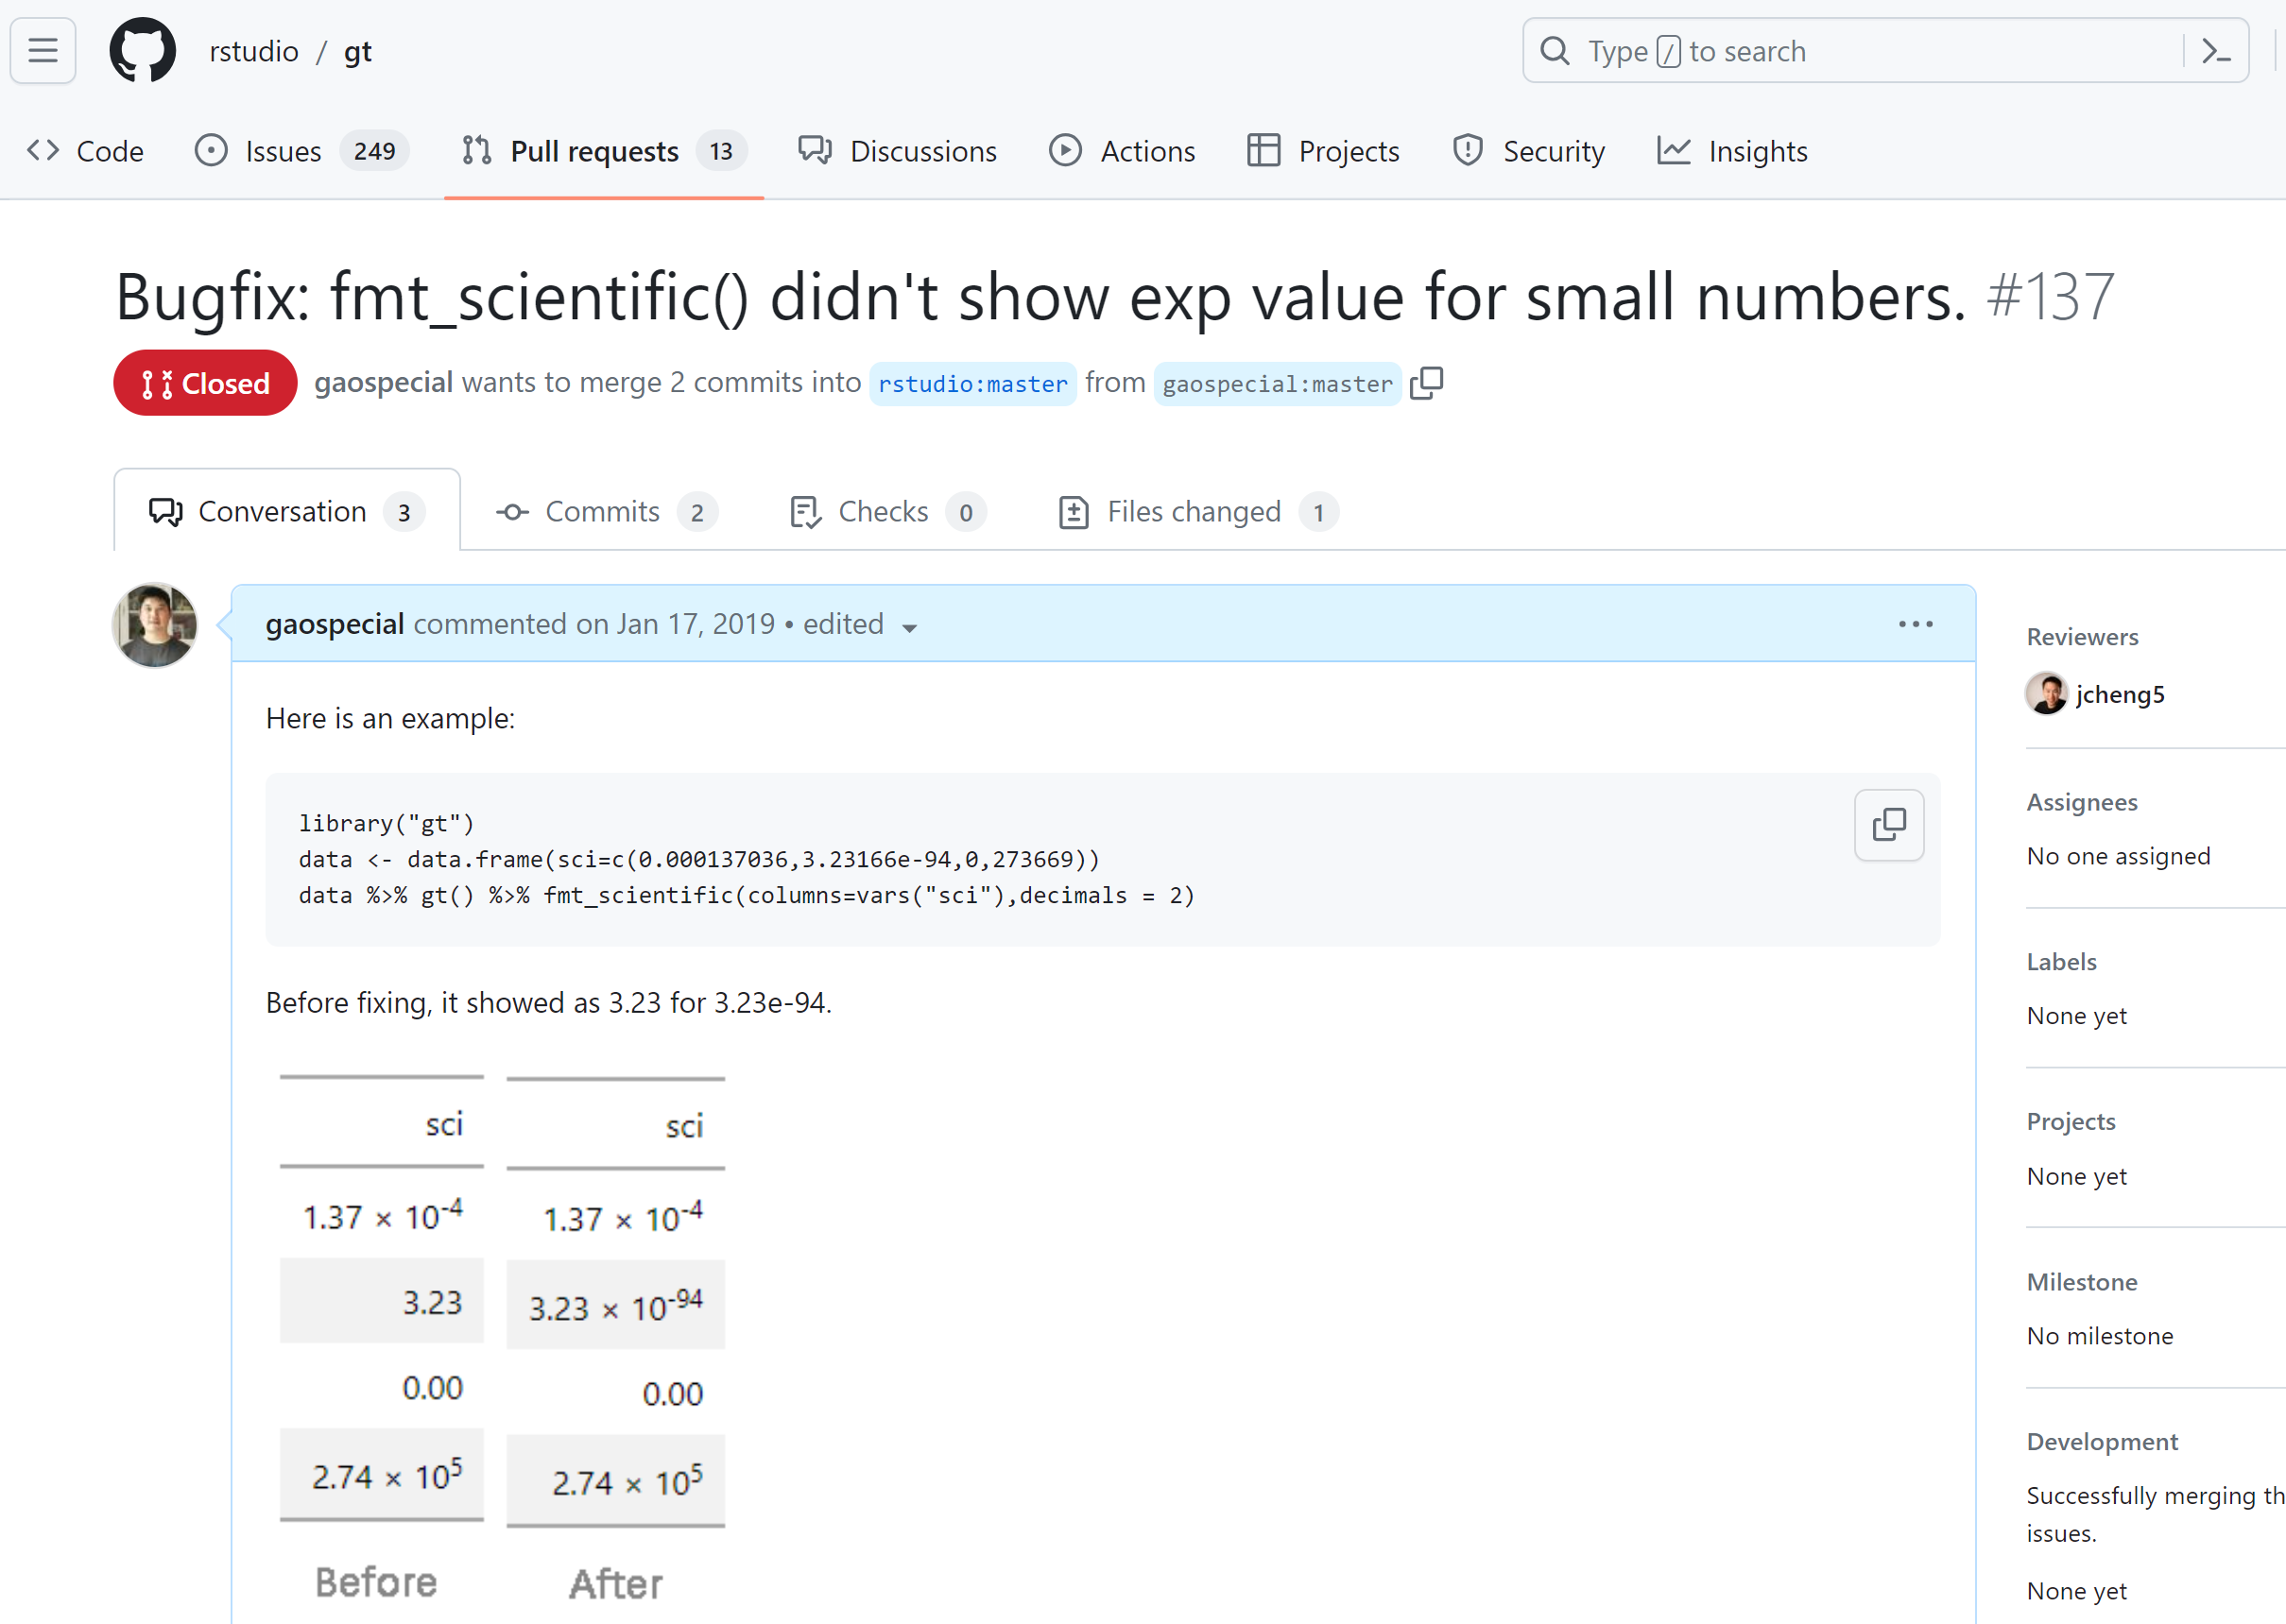 --- ### 华农 No. 1 - 被**刘浩**老师誉为华农搞 R 最**专业** 的人  --- ## 从两位生信大佬说起 - [余光创(*Y叔*)](https://yulab-smu.top/about/) - [陈程杰(*CJ*)](https://mp.weixin.qq.com/s/FVUWFRyFpVj2Kd_alKoeFw) --- ### 余光创  [余光创(*Y叔*)](https://yulab-smu.top/about/):南方医科大学生物信息学教授。 --- ### 陈程杰 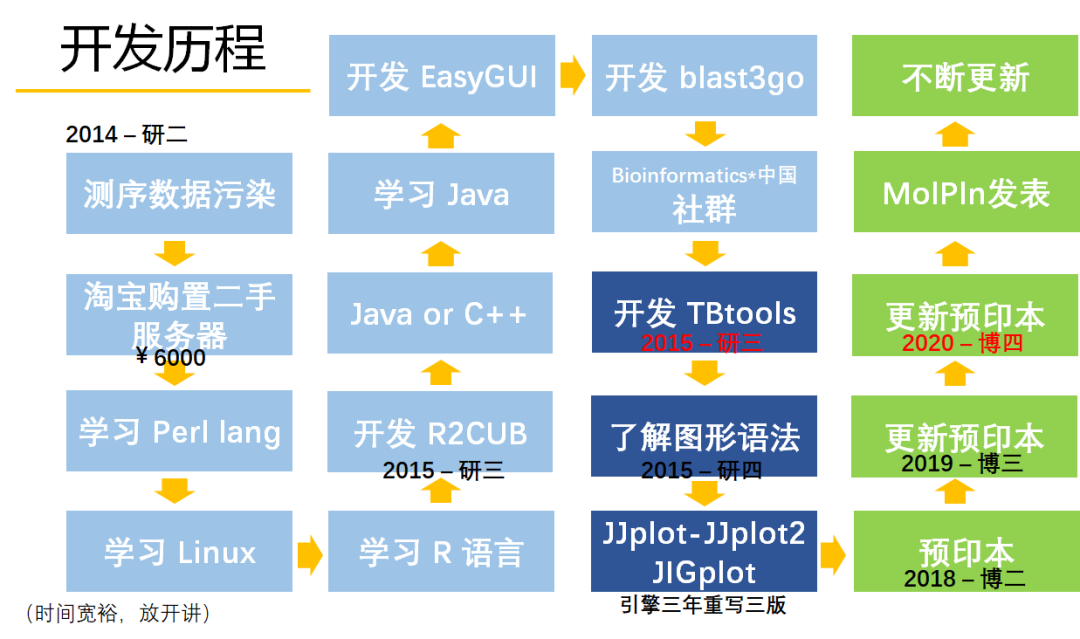 [陈程杰(*CJ*)](https://mp.weixin.qq.com/s/FVUWFRyFpVj2Kd_alKoeFw):TBtools 软件的开发者,年轻的生信专家。 --- ## 我的开发体会:ggVennDiagram ### 需求的产生:画一个韦恩图 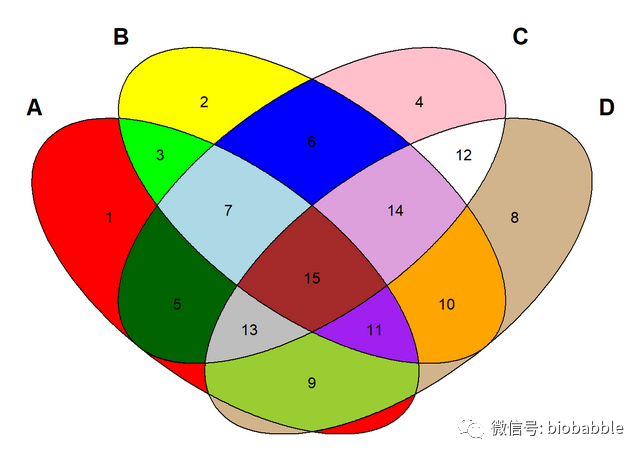 --- ### 任务的分解 - 区域(集合 + 子集),填充,标注 - 标签(集合 + 子集),文字 --- - 生成 4 sets椭圆 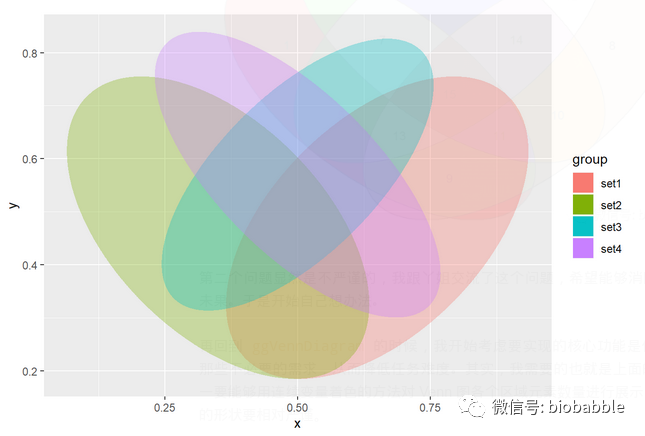 --- - 获取元素的子集 `union()`,`intersect()`,`setdiff()` - 获取图形的子集 `st_union()`、`st_intersect()`、`st_difference()`  --- - 计算中心点坐标 ```r library(sf) library(ggplot2) nc <- st_read(system.file('shape/nc.shp', package = "sf")) # using sf sf_cent <- st_centroid(nc) # plot both together to confirm that they are equivalent ggplot() + geom_sf(data = nc, fill = 'white') + geom_sf(data = sf_cent, color = 'red') ``` --- - 计算中心点坐标 <!-- --> --- - 添加文字 ```r # 多边形 ggpolygons = list(A=A,B=B,C=C,D=D,AB=AB,AC=AC,AD=AD,BC=BC,BD=BD,CD=CD,ABC=ABC,ABD=ABD,ACD=ACD,BCD=BCD,ABCD=ABCD) # 标签文字 polygon_names = names(ggpolygons) # 标签位置 data_centers = ... # 画图 ggplot(data_ploygons,aes(x,y,fill=group)) + geom_polygon(show.legend = F) + geom_text(aes(label=group),data=data_centers) ``` --- - 在正确的位置添加文字  --- ### 不得的取舍 开发一个画 Venn 图的包,它可以: - [√] 接受传统上的输出,输出优于 `VennDiagram` 和 `gplots` 的 Venn 图; - [√] 颜色/透明度/线型/粗细等各种自定义 - [×] 是否固定比例:参数 `scaled = True`。 - [√] 随意显示标签(label 和 text) - [×] 参数:circle 还是 ellipse?(circle在4d venn中并不能显示所有组合) - [√] 参数:color是不同色块还是按梯度填充? - [×] 接受直接的 `data.frame` 或者 `matrix` 输出, 通过指定 `Threshold` 自行创建存在矩阵, 按列分组, 按行计数; - [√] 也可以接受 `list` 输入; - [×] 如果分组过多(>5), 则使用 `upsetR` 绘制多种组合条件下的无限 `Venn` 图. - [√] Venn 图内每个空间内再分别上色. --- ### 算法的优化 **计算多边形的参数** - 原始版本 ```r library(sf) A <- st_difference(st_difference(st_difference(polygons[[1]],polygons[[2]]),polygons[[3]]),polygons[[4]]) B <- st_difference(st_difference(st_difference(polygons[[2]],polygons[[1]]),polygons[[3]]),polygons[[4]]) C <- st_difference(st_difference(st_difference(polygons[[3]],polygons[[1]]),polygons[[2]]),polygons[[4]]) D <- st_difference(st_difference(st_difference(polygons[[4]],polygons[[1]]),polygons[[3]]),polygons[[2]]) # ... ``` --- **计算多边形的参数** - 现代版本 ```r function(venn, slice = "all"){ overlap = overlap(venn, slice = slice) if (slice[1] == "all" | identical(venn@sets[slice], venn@sets)){ discern = NULL return(overlap) } else { discern = discern(venn, slice1 = slice) return(sf::st_intersection(overlap, discern)) } ``` --- **不规则图形的中心点** - `colorfulVennPlot` 的“硬核代码” ```r # Midpoints for hard-coded crossover regions midpoints <- data.frame( x = c(-4.37352, -6.04042, -6.04042, -0.43516, -0.32341, -2.19859, -2.19859, 5.65737, 6.16114, 7.03031, 6.04042, 2.54627, 2.54627, 2.53192, 2.53192), y = c(-0.65737, 5.43516, 2.45373, 11.04042, -2.03031, 7.19859, 2.46808, 9.36716, -1.16074, 5.31864, 2.45373, 11.04042, -1.04042, 7.19859, 2.46808), TF = c('1000', '0100', '1100', '0010', '1010', '0110', '1110', '0001', '1001', '0101', '1101', '0011', '1011', '0111', '1111')) ``` --- - 现在的代码 ```r process_region_data <- function(venn){ region_items <- get_region_items(venn) counts <- sapply(region_items, length) region_ids <- get_region_ids(venn) region_names <- get_region_names(venn) tibble::tibble( component = "region", id = region_ids, item = region_items, count = counts, name = region_names ) } ``` --- **现在准备画图数据的代码** ```r function(venn, ...){ shape <- get_shape_data(nsets = length(venn@sets), ...) plot_data <- VennPlotData( setEdge = filter(shape, component == "setEdge") %>% pull(xy), setLabel = filter(shape, component == "setLabel") %>% dplyr::pull(xy) ) plotData_add_venn(plotData = plot_data, venn = venn) } ``` --- ### 问题的解决 - 准备示例数据 ```r library(ggVennDiagram) genes <- paste("gene",1:1000,sep="") set.seed(20210419) x <- list(A=sample(genes,300), B=sample(genes,525), C=sample(genes,440), D=sample(genes,350)) ``` --- - 绘制韦恩图 ```r library(ggplot2) ggVennDiagram(x) + scale_fill_gradient(low="white",high = "red") ``` <!-- --> --- - 更多维的数据 ```r x <- list(A=sample(genes,300), B=sample(genes,525), C=sample(genes,440), D=sample(genes,350), E=sample(genes,200), F=sample(genes,150), G=sample(genes,100)) ``` --- - 七维 ```r ggVennDiagram(x, label = "none", edge_size = 2) + scale_fill_distiller(palette = "RdBu") ``` <!-- --> --- - 六维 ```r ggVennDiagram(x[1:6], label = "none", edge_size = 2) + scale_fill_distiller(palette = "RdBu") ``` <!-- --> --- - 五维 ```r ggVennDiagram(x[1:5], label = "none", edge_size = 2) + scale_fill_distiller(palette = "RdBu") ``` <!-- --> --- - 四维 ```r ggVennDiagram(x[1:4], label = "none", edge_size = 2) + scale_fill_distiller(palette = "RdBu") ``` <!-- --> --- ```r ggVennDiagram(x[1:3], label = "none", edge_size = 2) + scale_fill_distiller(palette = "RdBu") ``` <!-- --> --- ```r ggVennDiagram(x[1:2], label = "none", edge_size = 2) + scale_fill_distiller(palette = "RdBu") ``` <!-- --> --- ### 论文发表 - 被引很多次的论文  --- ### 包治百病  --- ## 如何开发一个 R 包? ### 实用工具 - RStudio - devtools - usethis - GitHub/Gitee - R Markdown --- ### 工作流程 - 初始化 - 添加代码和文档 - 测试和上传 - 分发(dev/stable) --- ### 演示 *在线演示* <http://122.205.95.109:8787/auth-sign-in?appUri=%2F> --- ### 如何维护? **非常重要的事情** - GitHub Issues - Pull request - CRAN update --- ## 我是不是华农最会搞 R 的人? - 请大家站在我的肩膀上,向上发展 - 请大家加入我的团伙,共同进步 - <https://github.com/gaospecial/rconf2020-my-org-first-pkg> - <https://r-pkgs.org/> --- ## 为自己写一个 R 包? - 既为自己:你的**需求**是什么? - 也为他人:领域的**需求**是什么? - 安装包的方式 - `devtools::install_github("gaospecial/ggVennDiagram")` - `remotes::install_github("gaospecial/ggVennDiagram")` - `pak::pak("gaospecial/ggVennDiagram")` --- ## 谢谢! - 我的微信:<@gaospecial> - 其它交流方式 - 个人网站:<https://bio-spring.top> - Github 主页:<https://github.com/gaospecial> - 邮件联系:<gaoch@mail.hzau.edu.cn>